Introduction and Objectives
Cladistics is a method of classifying organisms based on shared derived characteristics that are inherited from a common ancestor.
The result is displayed as a cladogram (a branching, tree-like diagram representing a hypothesis about the evolutionary relationships among a group of organisms).
Modern taxonomy increasingly bases its classification on cladograms, grouping organisms into clades (monophyletic groups: an ancestor and all of its descendants) rather than on overall physical similarity alone.
Your Objectives
- Construct a cladogram from a given character (trait) matrix by applying the principle of parsimony.
- Identify and label the key features of a cladogram: root, node, branch, tip, clade, synapomorphy (shared derived characteristics), sister taxa, and outgroup.
- Use a character matrix and a dichotomous key to classify unidentified specimens, and relate the resulting cladogram to Linnaean taxonomic ranks.
Technical Skills and Necessary Tools
The success of this exercise depends on reading character data carefully, comparing taxa systematically, and applying a small set of simple, consistent rules. None of the individual steps is difficult. The challenge is doing them all carefully, and in the right order.
Skills Required
- Reading a Character Matrix
A table listing taxa (organisms or groups) in rows and characters (observable traits) in columns. Each cell is scored 0 (the ancestral, or primitive, state) or 1 (the derived, or new, state). You must be able to scan along a row (all the traits of one taxon) and down a column (which taxa share a given trait) without making transposition errors. - Determining Character Polarity
Decide which state of a character is ancestral and which is derived. This is done by comparing the taxa being studied (the ingroup) to an outgroup (a taxon known to lie outside the group of interest). Whatever state the outgroup shows for a character is treated as the ancestral (0) state. - Applying Parsimony
Of all the possible tree shapes that fit the data, choose the one that requires the fewest evolutionary changes (character-state changes) overall. This is the same logic as Occam’s Razor, the simplest explanation that fits the evidence is preferred. - Drawing and Re-drawing Tree Diagrams:
Cladogram construction is iterative. You will sketch, check, and redraw your tree several times. Work in pencil on paper, and keep branch spacing and tip positions consistent so the diagram stays readable as you revise it. - Constructing and Using a Dichotomous Key
Build a series of paired (two-choice) statements that progressively narrow down the identity of a specimen, and follow such a key accurately, step by step, without skipping ahead.
Tools and Materials
- Character Matrix Worksheet
A printed or provided data table listing at least 4-6 taxa (including one outgroup) and 4-6 characters, each scored 0 or 1. - Paper, Pencil, and Eraser
For sketching and revising cladograms - Ruler
To draw straight, evenly spaced branches and keep the diagram tidy. - Specimen Set
A set of real specimens, photographs, or drawings of organisms (e.g., insect orders, leaf shapes, shells) for the dichotomous key activity.
Constructing a Cladogram from a Character Matrix
This procedure builds a cladogram for a small group of taxa from a character matrix, in the same way the data are typically presented in an IJSO-style practical task.
- Set up the matrix
List your taxa down the left-hand column, including one outgroup, and your characters across the top. Confirm that the outgroup is scored 0 for every character (If it is not, re-check which state is truly ancestral before continuing). - Find the shared derived characters (synapomorphies)
For each character (column), identify which taxa share state 1. A group of taxa that all share a derived state is a candidate clade (a group that may share a single common ancestor). - Order the characters by inclusiveness
A character shared by many taxa defines an early, more inclusive branching point. A character shared by only a few taxa defines a later, more nested branching point. Arrange your candidate groupings from “most taxa share this” to “fewest taxa share this.” - Draw the tree branch by branch
Start by separating the outgroup from all other taxa at the root. Then add nodes one at a time, in order of inclusiveness, nesting smaller groups inside larger ones so the diagram forms a series of “boxes within boxes.” - Label each node with its synapomorphy
At every branching point, write the character (and the state change, e.g. “C2: 0→1”) that defines that node. This shows exactly what evidence supports each branch. - Check for parsimony (count the steps)
Count the total number of character-state changes required by your tree (normally one step per character, at the node where it first appears). If an alternative arrangement explains the same data with fewer steps, that arrangement is more parsimonious and should be preferred.
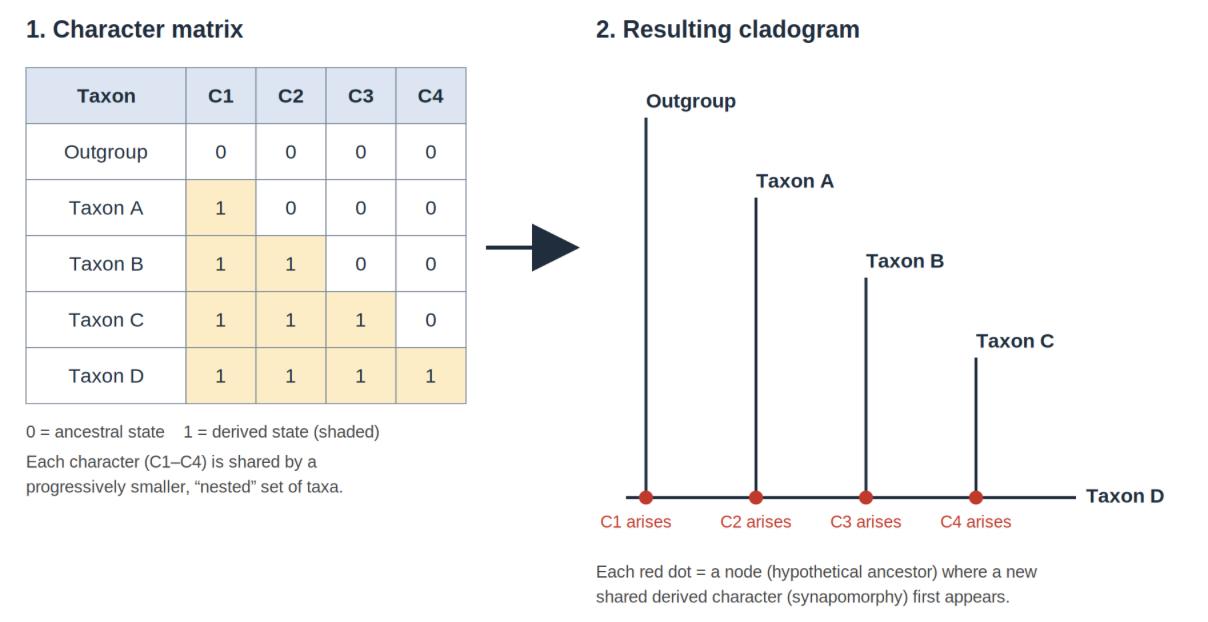
(Diagram: A character matrix (taxa x characters, scored 0/1) and the cladogram that results from applying Steps 1-6, with each node labelled by the character that defines it.)
Expected Results and Interpretation
A correctly constructed cladogram allows several conclusions to be read directly from its shape and labels.
Reading the tree:
- Root: The starting point of the tree, where the outgroup diverges from the rest. It represents the most ancestral condition shown in the diagram.
- Node (branch point): Represents a hypothetical common ancestor and the point where one lineage split into two, a speciation event.
- Clade: Any node together with all of the branches and tips descending from it. A clade is a monophyletic group, it contains an ancestor and ALL of its descendants, no more and no less.
- Sister taxa: Two lineages that share the most recent common ancestor i.e., the two branches that diverge from the same node. Sister taxa are, by definition, equally related to any other taxon on the tree.
- Recency of branching (not left-right position) shows relationship: Any branch may be rotated around its node without changing the relationships shown. Two taxa are more closely related if they share a more recent (more closely nested) common ancestor, not because they happen to be arranged left-to-right on the page.
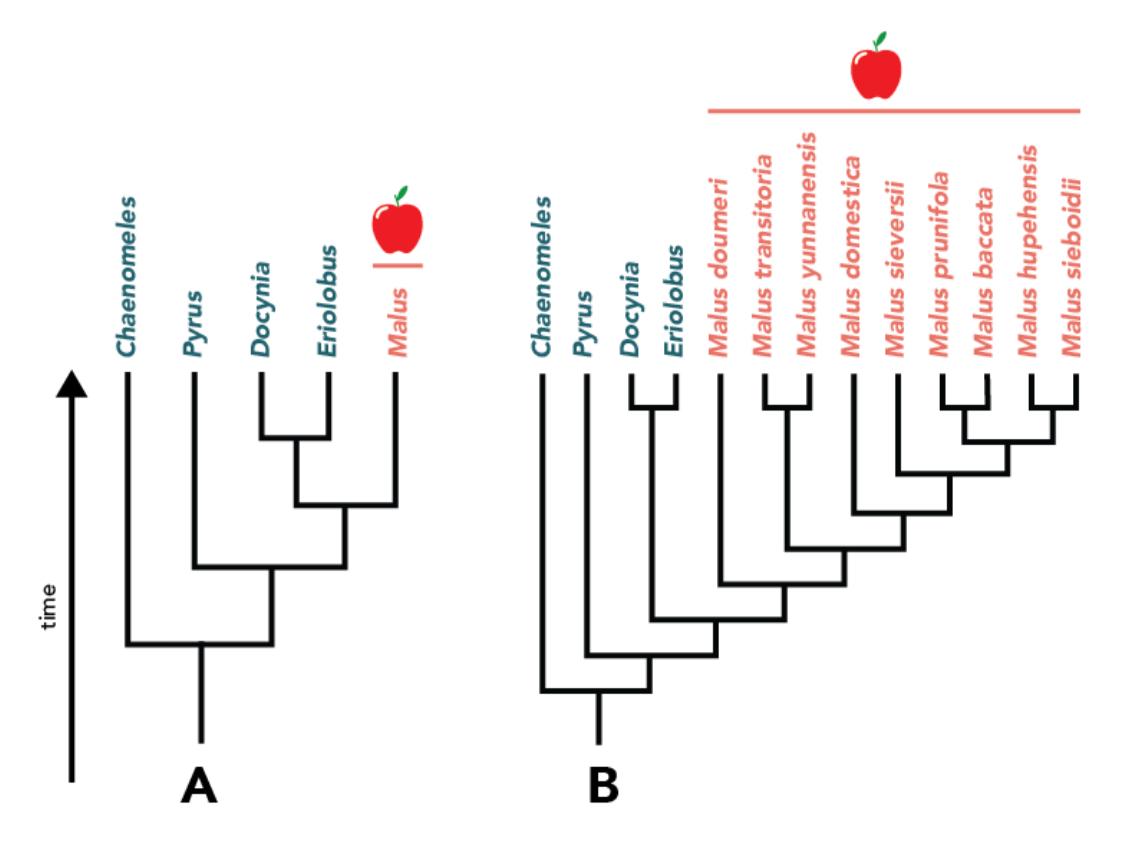
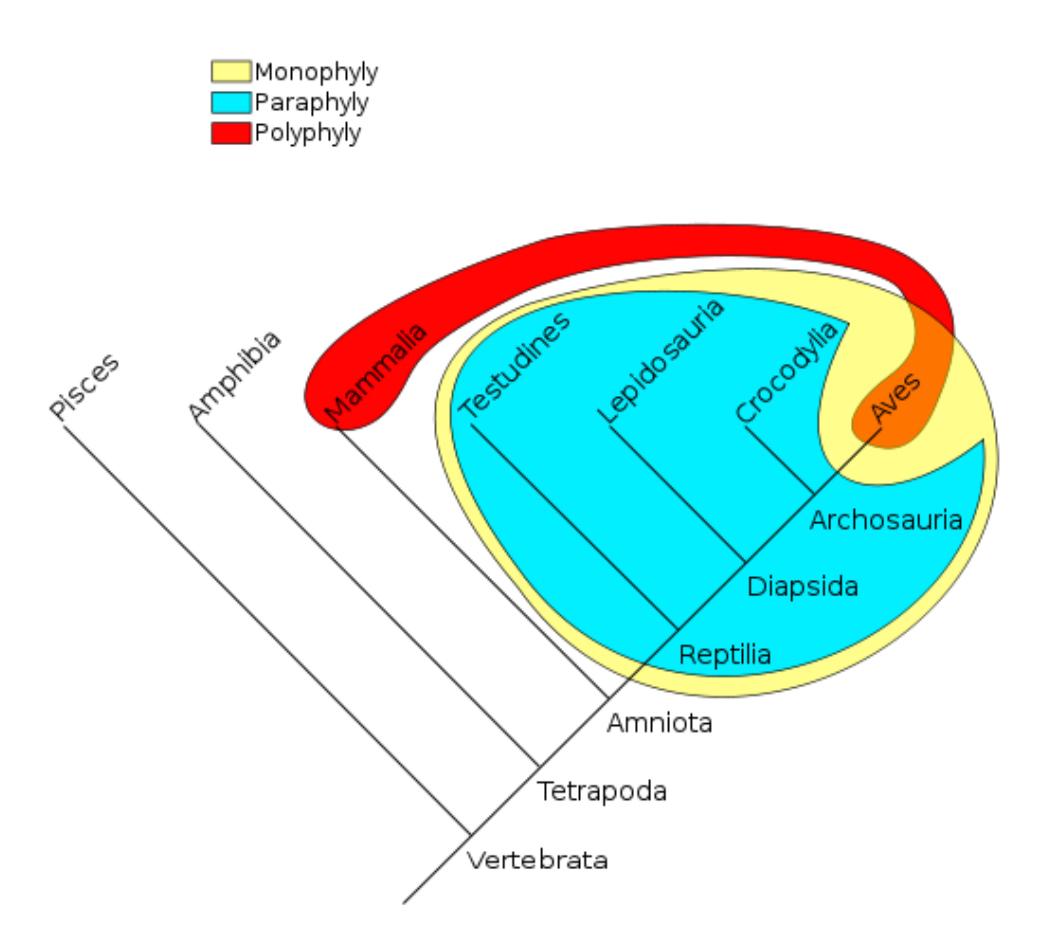
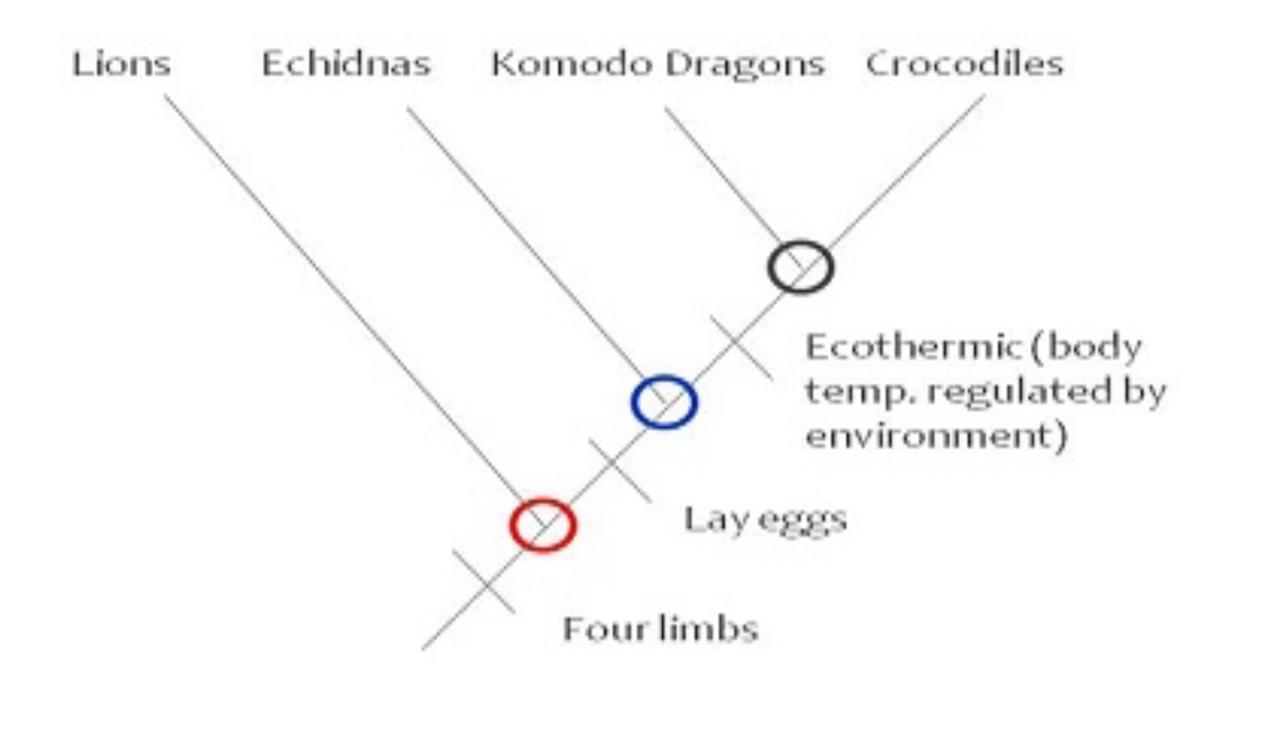
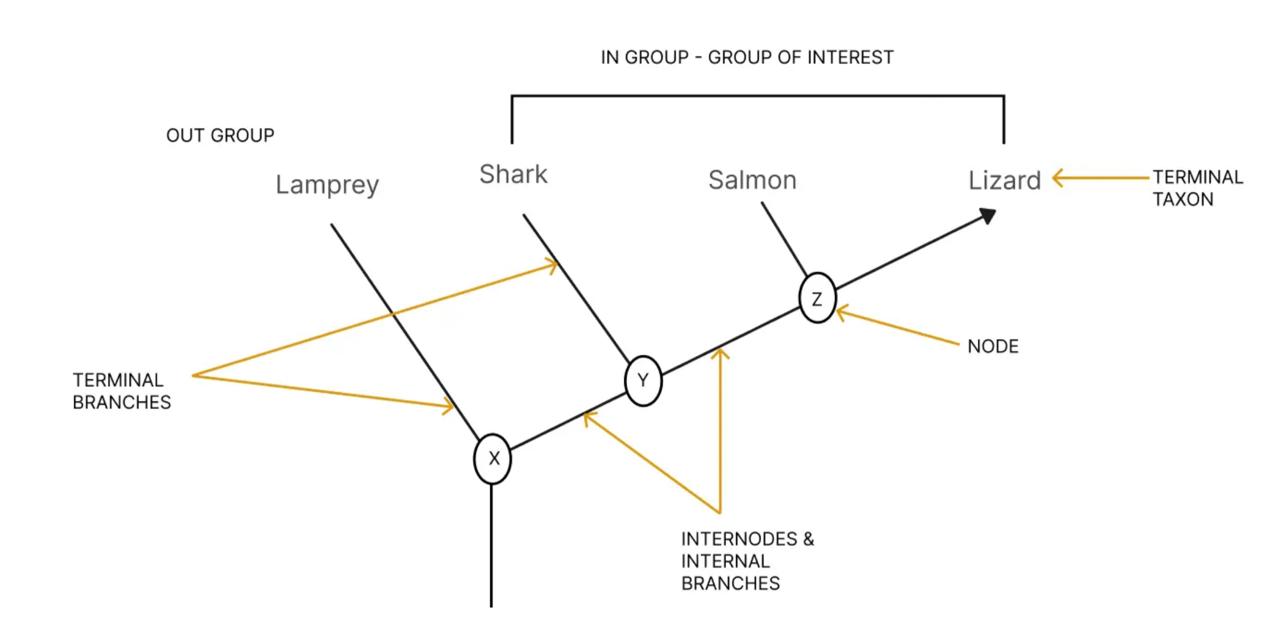
(Diagram: The anatomy of a cladogram, consisting of root, branch, node, tip, clade, sister taxa, and outgroup.)
Connecting Cladograms to Taxonomy
- Modern classification aims to name groups that correspond to clades (monophyletic groups) rather than groups based on overall appearance. A classification that leaves out some descendants of a common ancestor is called paraphyletic (for example, the traditional class “Reptilia” excluding birds, even though birds share a more recent common ancestor with crocodiles than crocodiles share with lizards).
- The Linnaean ranks (domain, kingdom, phylum, class, order, family, genus, species) can be thought of as labelled levels of nesting on a cladogram, each more inclusive rank corresponds to a deeper, less nested node. This classification is currently being phased out.
- For the dichotomous key task, the expected result is a correctly completed identification for every specimen, together with the full path of couplet numbers used to reach it. Two specimens that share most of their path through the key are also expected to sit close together, as sister taxa or within the same clade, on a cladogram built from the same characters.
Common Mistakes and Troubleshooting
- Grouping by overall similarity instead of shared derived characters
Two organisms can look similar because they share a feature inherited from a common ancestor (homology) or because they evolved that feature independently (convergence, e.g., wings in birds and insects). Before using a character to define a clade, check that it is plausibly homologous, not just superficially similar. - Forgetting or mis-identifying the outgroup
Without a correctly chosen outgroup, you cannot determine which character state is ancestral and which is derived, and the whole tree may effectively be built “upside down.” Always confirm the outgroup scores 0 for every character before proceeding. - Treating left-right order as meaningful
A common error is to assume the taxon drawn at the top, bottom, or end of the tree is somehow more “advanced” or “primitive.” Branches can be freely rotated around their nodes, only the pattern of nesting (which nodes are shared) carries information. - Ignoring parsimony and accepting the first tree drawn
It is easy to draw a tree that “fits” the data but uses extra, unnecessary steps. Always count the total number of character-state changes and check whether a simpler arrangement explains the same data. - Writing ambiguous or overlapping couplets in a dichotomous key
If both statements in a couplet could apply to the same specimen (or neither does), the key cannot be followed reliably. Use objective, easily observed, either/or characters, and test the key on someone unfamiliar with the specimens. - Losing track of numbering when revising a key
If a couplet is added, removed, or renumbered, every “go to” reference elsewhere in the key must be updated. Work through the finished key from couplet 1 to confirm that every path ends at a named specimen.