Introduction
Light energy represents a basic resource needed for photosynthesis.
Your goal in this practical test is to observe the variations that conditions connected to this environmental factor (intensity and spectral composition) generate in the intensity of photosynthesis.
Hypothesis
Supposing, for example, that photosynthesis does not take place in an extreme environmental condition (below freezing pH 1-2, etc.) we will be changing the parameters of select environmental conditions in order to observe any changes that may take place.
To measure photosynthesis, we will use the oxygen bubble release method, to which you will find explanations below.
Necessary Tools and Materials
- Submerged aquatic plants (e.g. Elodea canadensis, Mycrophyllum sp. etc)
- Test tubes and statives
- Glass wand
- Lamp powered by a 100W lightbulb
- Colored filters (transparent plastic sheets in red, green and blue)
- Sharp razor
- Water (not distilled)
- Stopwatch
- Ruler
Experimental Method
Oxygen bubble release method
Section the plant stems diagonally with the razor so that you obtain a 6-10cm long specimen.
Submerge it fully under water in a test tube with the sectioned part facing upward and observe the release of oxygen bubbles.
Choose for analysis a specimen that releases an approximately constant number of bubbles per minute (20-40/min).
Use the stopwatch for accurate determination of time intervals.
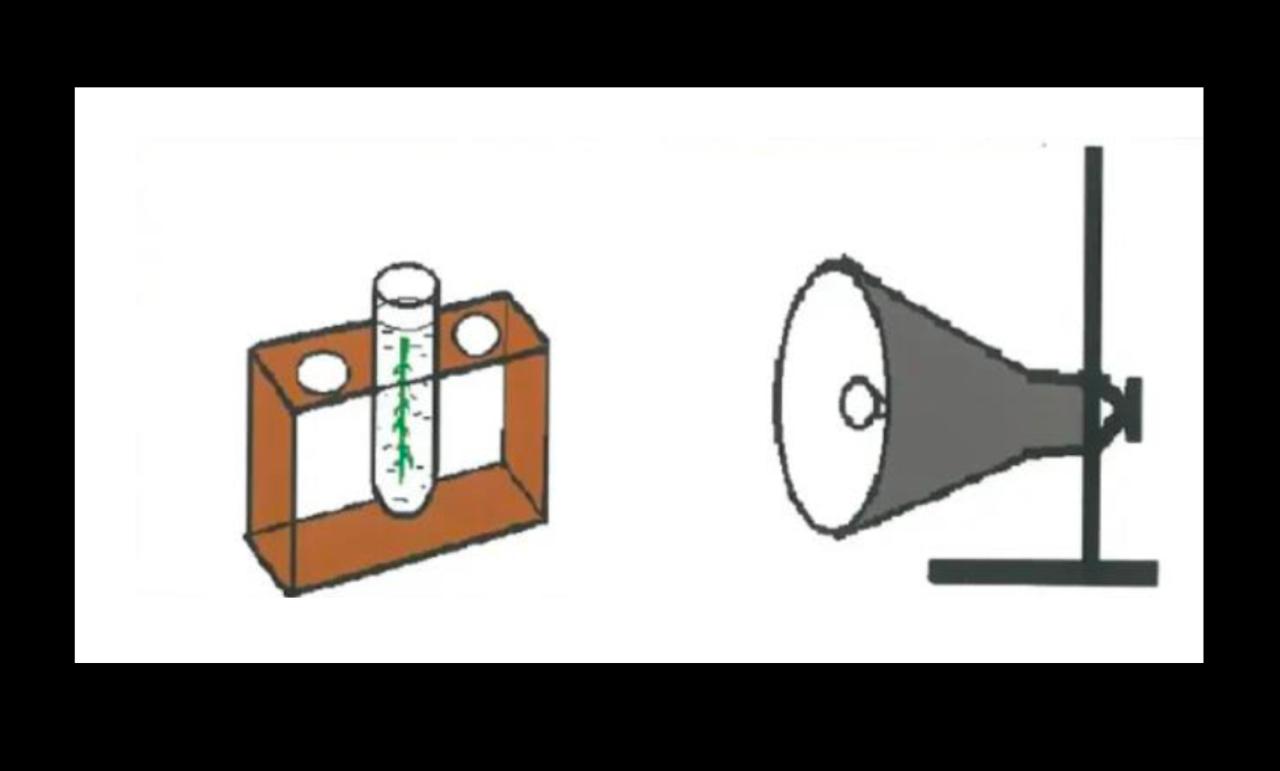
Observation of the influence of light intensity
Each set distance between the lightbulb and the specimen, count the number of bubbles released per minute and organize the data in a table and a graph of \(\text{I} = \text{f} \; (\text{d}^2)\)
where
- I represents the intensity of photosynthesis measured in number of bubbles/minute
- d is the distance, measured in centimeters using the ruler, between the lightbulb and the plant specimen.
Observation of the influence of the spectral composition of light
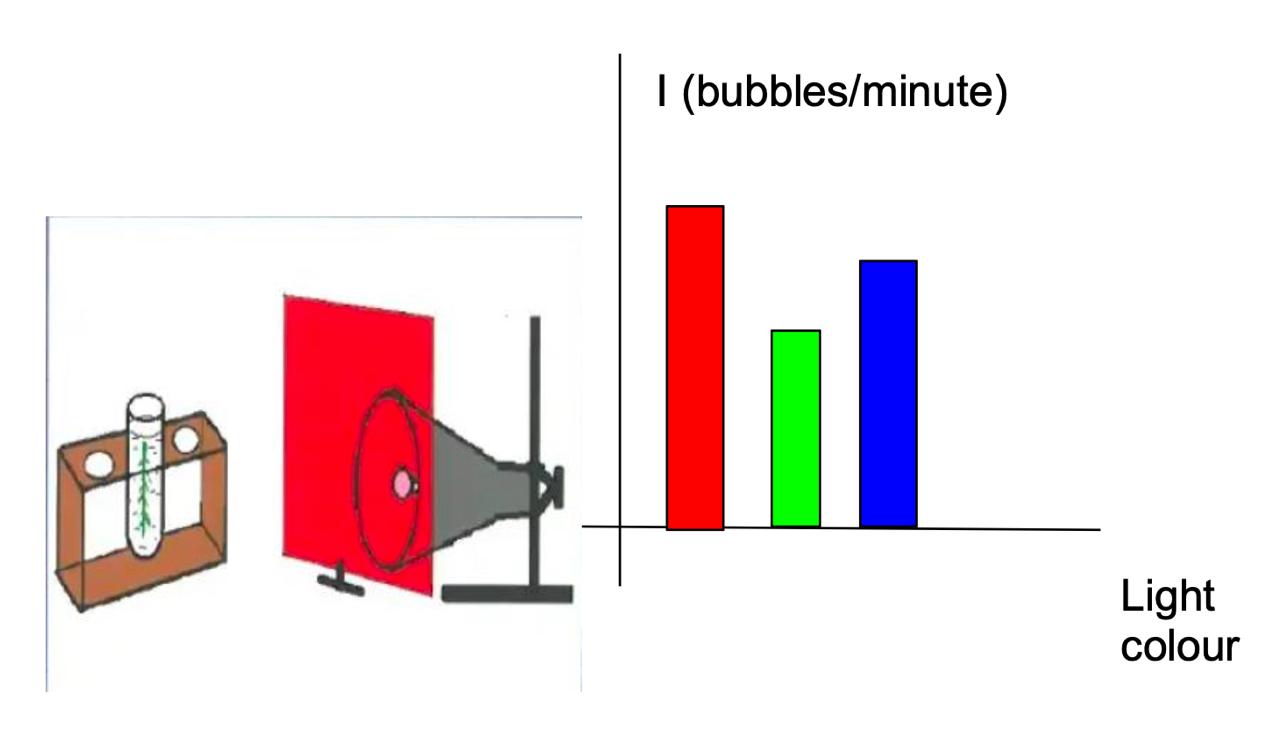
Without modifying the distance between the specimen and the light source (20-30cm), place successively the colored plastic filter sheets between the bulb and the plant, counting, for each color used, the number of oxygen bubbles released per minute.
Use the data collected to fill out a chart.
Expected results and conclusions
Light intensity on the plant surface decreases in direct proportion to the square of the value d, and so does the intensity of photosynthesis.
Between 50.000 and 100.000 lux, the rate of photosynthesis remains constant for most plants.
When the maximum intensity is surpassed, cellular lesions may decrease the speed of the process.
In regions where light resources are scarce, the maximum plateau of photosynthesis is reached for a lower value of the light intensity parameter, due to adaptations such as thinner leaves and larger chloroplasts that are richer in chlorophyll.
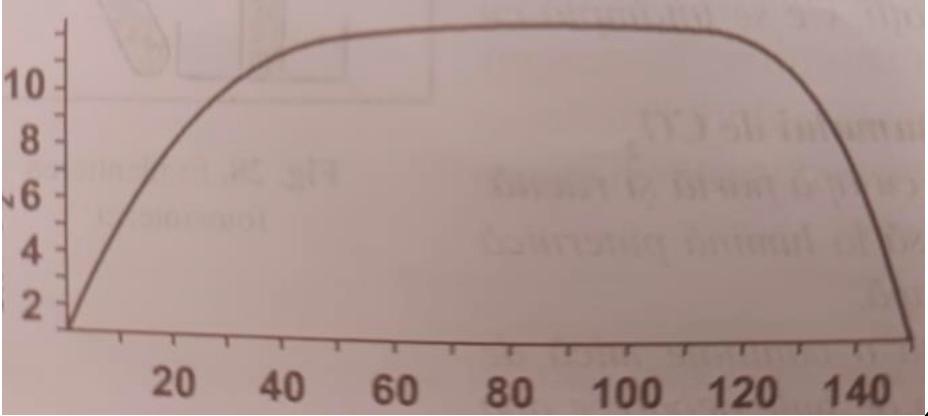
x-axis: light intensity in thousands of lux; y-axis: hourly rate of photosynthesis
Light color corresponds to the wavelength of luminous radiation, so chlorophyll will best absorb the complementary colour, therefore, the highest rate will be registered in the case of the red filter.
The green light is the one that exhibits the least capacity of absorption, it being reflected by the leaves, and blue falls somewhere in the middle, as shown in the bar chart above.
Troubleshooting, sources of inaccuracy and necessary skills
The completion of this task tests the ability of accurately counting the number of bubbles released, the reaction time in the usage of a stopwatch and precision skills when it comes to linear distance measurements.
Therefore, inaccuracies may occur due to improper or inattentive counting, parallax errors when using the ruler and because of the imprecisions of the measuring instruments themselves.
To decrease these inaccuracies, one must make sure to leave enough time between consecutive measurements in order to allow the biological specimen to adapt to the modified conditions and follow the experimental procedure attentively.